Breaking
Latest tech news from South Africa and around the world•Stay updated with breaking technology developments•Innovation and digital transformation news•AI, gaming, and gadget updates daily•Crypto and fintech news from Africa•
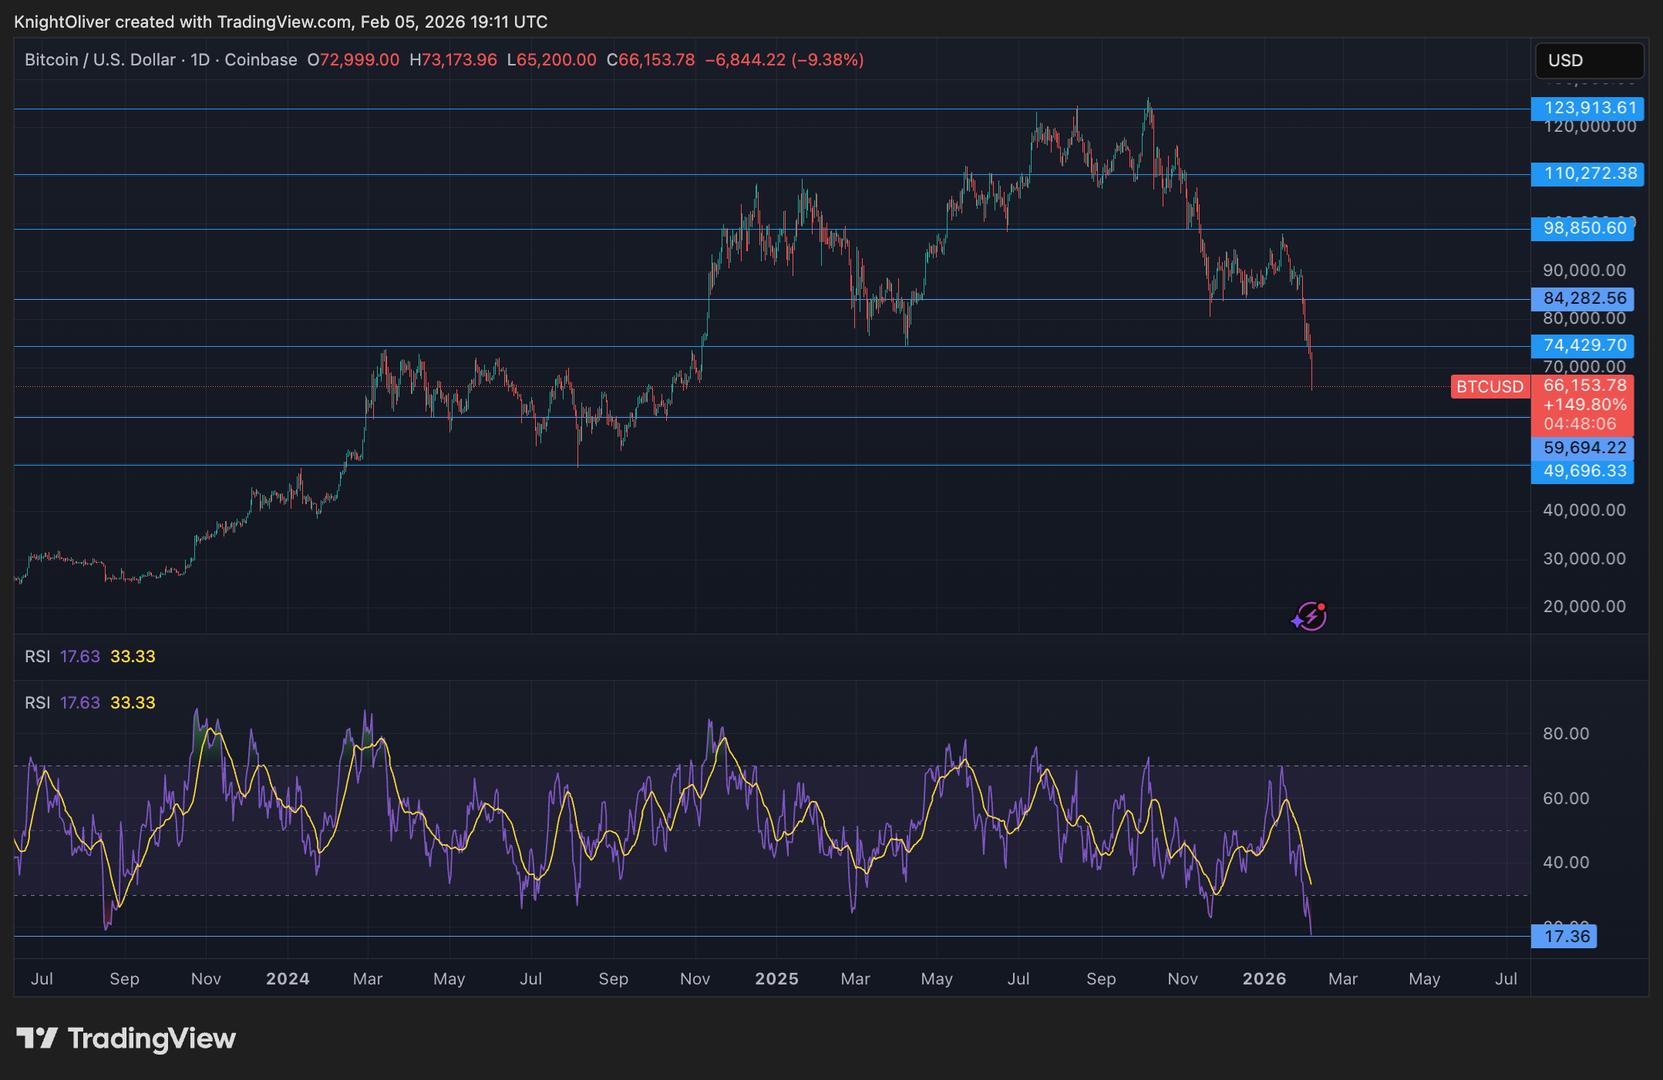
The Relative Strength Index (RSI), a popular technical trading indicator, has plunged to 17. Only the bear market bottom in 2018 and the 2020 Covid crash saw lo...
Bitcoin’s daily momentum has slipped into territory reached only twice before. History suggests those moments mattered. What it does not show is what breaks if they do not hold this time. Bitcoin slid sharply this week as forced selling rippled through derivatives markets. Prices briefly traded near $65,000, down more than six percent on the day, as leverage unwound across major exchanges. Liquidations topped $1.5 billion according to derivatives tracking data. That figure captures speed more than scale. It says little about who was forced out or who absorbed the flow. One technical measure now sits at an extreme rarely observed. Bitcoin’s daily Relative Strength Index fell to roughly 17 on Thursday. The indicator measures recent price momentum on a scale of zero to 100. Readings below 30 are typically labelled oversold. A print in the teens is uncommon for any liquid asset. In Bitcoin’s trading history, daily RSI has only fallen lower on two occasions. The first was the 2018 bear market low. The second came during the March 2020 Covid panic when global markets seized at once. Both moments marked exhaustion rather than recovery. Price continued to move violently. Direction came later. After the 2018 low, Bitcoin rose from about $3,150 to nearly $13,800 over the following eight months. The 2020 crash was followed by a longer repricing cycle. Bitcoin climbed from under $4,000 to above $60,000 over the next year. Those outcomes are often cited. The conditions that produced them are less discussed. The current drawdown has been driven less by spot selling than by leverage reset. Open interest across perpetual futures collapsed as margin calls accelerated. That kind of move tends to flatten positioning quickly. It does not resolve whether buyers with cash are prepared to step in at scale. Market depth data shows thin liquidity above the current range, particularly between $70,000 and $80,000. That absence cuts both ways. If demand appears, price can move quickly. If it does not, the lack of bids below matters more. RSI does not predict timing. It does not account for funding stress, macro data, or regulatory pressure. It only signals that selling pressure has been extreme relative to recent history. Traders often treat that as an invitation. Others treat it as a warning that something has changed. For now, the indicator is flashing. Price has stopped falling but has not stabilised. What follows depends less on precedent than on who is still willing to deploy capital into a market that just forced billions out.
Source: SA Tech News